Ask someone to picture business forecasting and they will likely describe a spreadsheet of last year’s sales and a hunt for the right formula. Find the formula, the thinking goes, and next quarter takes care of itself.
Markets don’t work that way. Demand responds to events, to decisions and to expectations. If enough buyers believe a shortage is coming, orders shift months before any official statistic records it.
Forecasting well in that kind of world doesn’t mean finding one perfect model. It means building many good ones, testing them honestly, and letting them inform a single forecast.
A forecast is a range, not a promise
Every time series mixes two things. Signal is the pattern you can learn: trend, seasonality, the pull of a leading indicator. Noise is everything else: a one-off bulk order, a wet week, a shipment stuck at port.
Noise cannot be predicted; that is what makes it noise. So a forecast is never a promise about the exact number. It is a central estimate with a band of plausible outcomes around it.
That central estimate is usually the expected value, the average of what could happen. It is not always the single most likely outcome.
When results are lopsided, such as steady sales with the occasional very large order, the two can sit far apart. That is one more reason the range deserves as much attention as the point.
It also changes what a good model looks like. A model that reproduces every bump in your history has probably memorized noise rather than learned signal.
Why more can mean worse
It’s tempting to keep adding indicators until the model hugs the past. Each one seems to explain a little more, and the fitted line looks better every time.
This is overfitting. Every new variable brings parameters to estimate, and a limited history can only support so many. Past a point, the model starts tracing random wiggles instead of real patterns.
On historical data, an overfit model often looks better than a sound one. That is exactly why fit to the past can’t be the judge; accuracy on data the model hasn’t seen can. A useful discipline is to make every model clear three bars:
- Beat a naive forecast, such as repeating the last value or last year’s season.
- Beat the best model that uses only the target’s own history.
- Beat a simple model built on the main drivers alone.
If it can’t, the extra complexity isn’t paying for itself.
The same trap waits one level up. Try enough models and keep whichever backtests best, and some winners will be lucky rather than good. Keep a stretch of data the selection never touched, prefer averages over a single champion, and be wary of a model that wins by a hair.
The goal was never zero error. It is a model that captures the structure and is honest about the noise.
The Rashomon effect
In Akira Kurosawa’s 1950 film Rashomon, several people recount the same crime. Every version is plausible, and no two agree.
Statisticians borrowed the name for a familiar situation: on the same data, many different models often perform almost equally well. One might rely on interest rates and consumer confidence; another on freight costs and purchasing managers’ indices. Both forecast well, and each tells its own story about what moves your market.
So which one is right? None of them is the whole truth, because every model simplifies. When several perform this closely, each is a useful account of the same market, and that is the moment to stop polishing one model and start listening to all of them.
When your model changes its mind
A question we hear often: “Why did my model pick different variables this month?” Usually the answer is reassuring, but not always.
When several candidates are nearly interchangeable, a little new data can tip the choice. This is especially likely when they are strongly correlated, like two surveys measuring the same business mood. The selected variables change while the forecast barely moves: the Rashomon effect at work, not a fault.
Switching can also be a warning sign. If it happens constantly, or the forecast jumps each time, the selection may be unstable, a symptom of overfitting or of candidates that carry little real information. Some methods are prone to this; Lasso, for instance, picks almost arbitrarily among correlated predictors.
Three questions tell the two cases apart:
- Did the forecast itself change materially, or only the variables behind it?
- Did out-of-sample accuracy hold up after the switch?
- Is the new variable a close cousin of the one it replaced?
Combining several models, rather than relying on whichever one is selected this month, smooths most of this out.
Finding the common core
Line up the strongest models and a pattern emerges. Some drivers appear in nearly all of them; others turn up in one or two, or only for a while.
The recurring drivers form a common core, and they deserve the most confidence. The occasional ones may help today, but don’t build plans around their staying.
Count with care, though, because frequency is not the same as importance. If two indicators measure much the same thing, they may split the appearances and each look minor. Group closely related indicators before deciding what belongs in the core.
None of this establishes cause and effect. Causal conclusions from observational data are possible, but they need deliberate research designs and strong assumptions that forecasting models aren’t built around. These models are chosen because they predict well, not because they explain why.
Agreement among strong models is the most reliable predictive story the data offers. That is valuable, and it is different from a causal one.
How Indicio puts this into practice
Indicio is built around this way of working. Rather than committing to one method in advance, it tests a broad range of models on your data and lets out-of-sample results decide. A typical workflow:
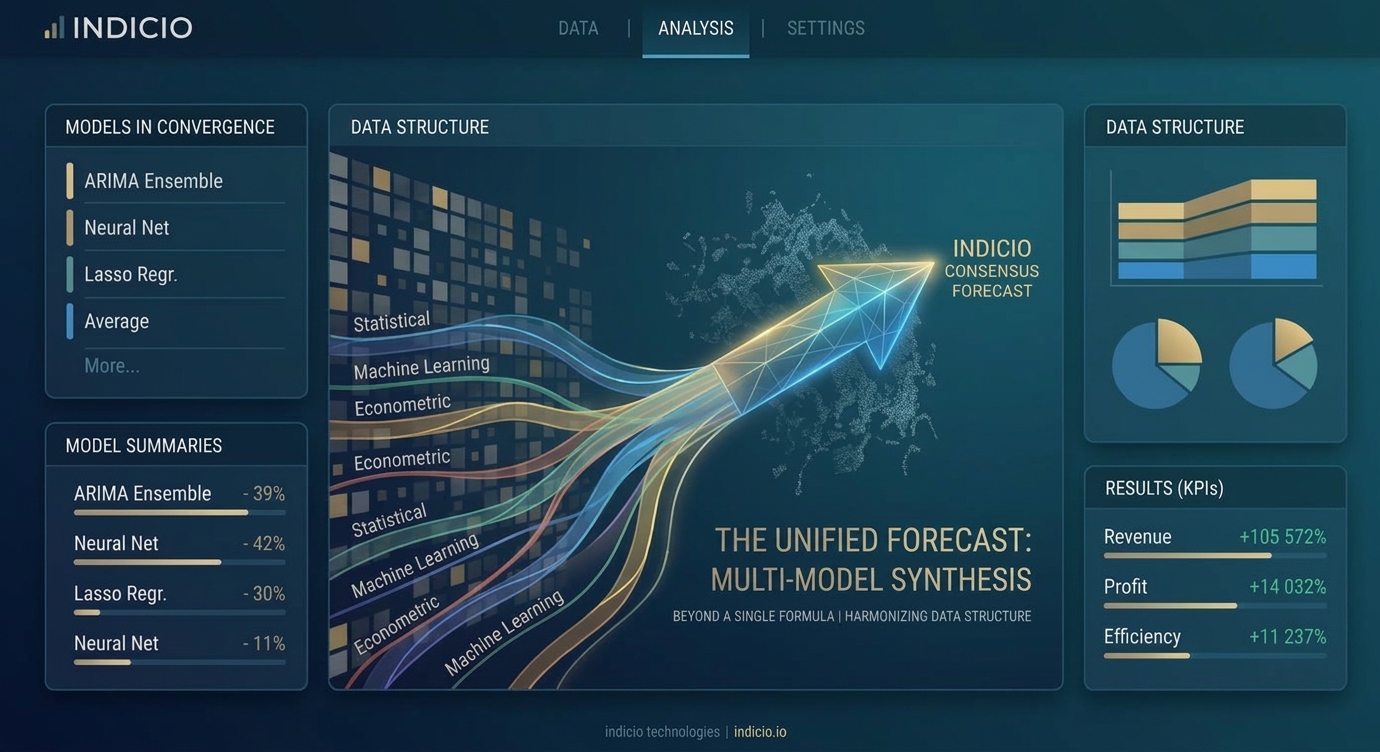
- Build many models. Econometric, statistical and machine-learning approaches, from ARIMA and error correction models to Lasso and neural networks, using your data and your leading indicators.
- Backtest them. Each model is scored on how well it would have forecast the past, not on how closely it fits it.
- Combine the best. The top performers are pooled into one forecast, so no single story carries all the weight.
- Read the shared story. SHAP values show how much each driver pushes the combined forecast up or down. They describe how the forecast uses each driver, not how the market works, and correlated drivers can split the credit between them.
- Explore scenarios. Change a driver and see how the forecast responds, next to your baseline.
Scenarios deserve a caution of their own. “What if this driver moves?” only has a trustworthy answer if the driver actually influences what you are forecasting. If it merely tends to move first, because it shares a cause with demand, shifting it tells you about the model rather than the market.
So use scenarios for drivers with a credible mechanism behind them, and keep the shifts within the range history has seen. Treat the results as stress tests for your plans, not predictions.
Humans with algorithms
Algorithms are good at processing data, but they don’t read the news or sit in customer meetings. People do, and that knowledge belongs in the forecast.
People bring biases too. One is confusing a forecast with a target: a forecast is an objective view of what is likely, a target is what we want. When the person forecasting sales is also measured on hitting them, hope leaks into the number.
Another is anchoring: once you have seen a number, your own estimate drifts toward it. So the order in which statistical and human forecasts are shared matters. Ideally, people write down their own view before they see the model’s.
The point isn’t to pick a side. Let the statistics do what they do well, let people do what they do well, and design the process so each can correct the other.
One source of truth
In many companies, sales, finance, marketing and operations each keep their own forecast. Plans built on different numbers don’t fit together, and the mismatch is expensive.
Hierarchical forecasting brings these views into one. You forecast at every level, from the total down through region, product and channel, then reconcile the levels so they add up. When someone with local knowledge adjusts one level, the others update to stay consistent.
When you share the result, share the range as well as the number. Once a forecast leaves the analytics team, it tends to harden into a certain figure for whoever needs one, and showing the uncertainty keeps decisions honest.
Takeaway
Good forecasts don’t come from one perfect formula. They come from many good models, tested honestly and combined into one forecast with its uncertainty in plain view. Trust what the models agree on, watch where they disagree, and remember that predicting well is not the same as explaining why.