

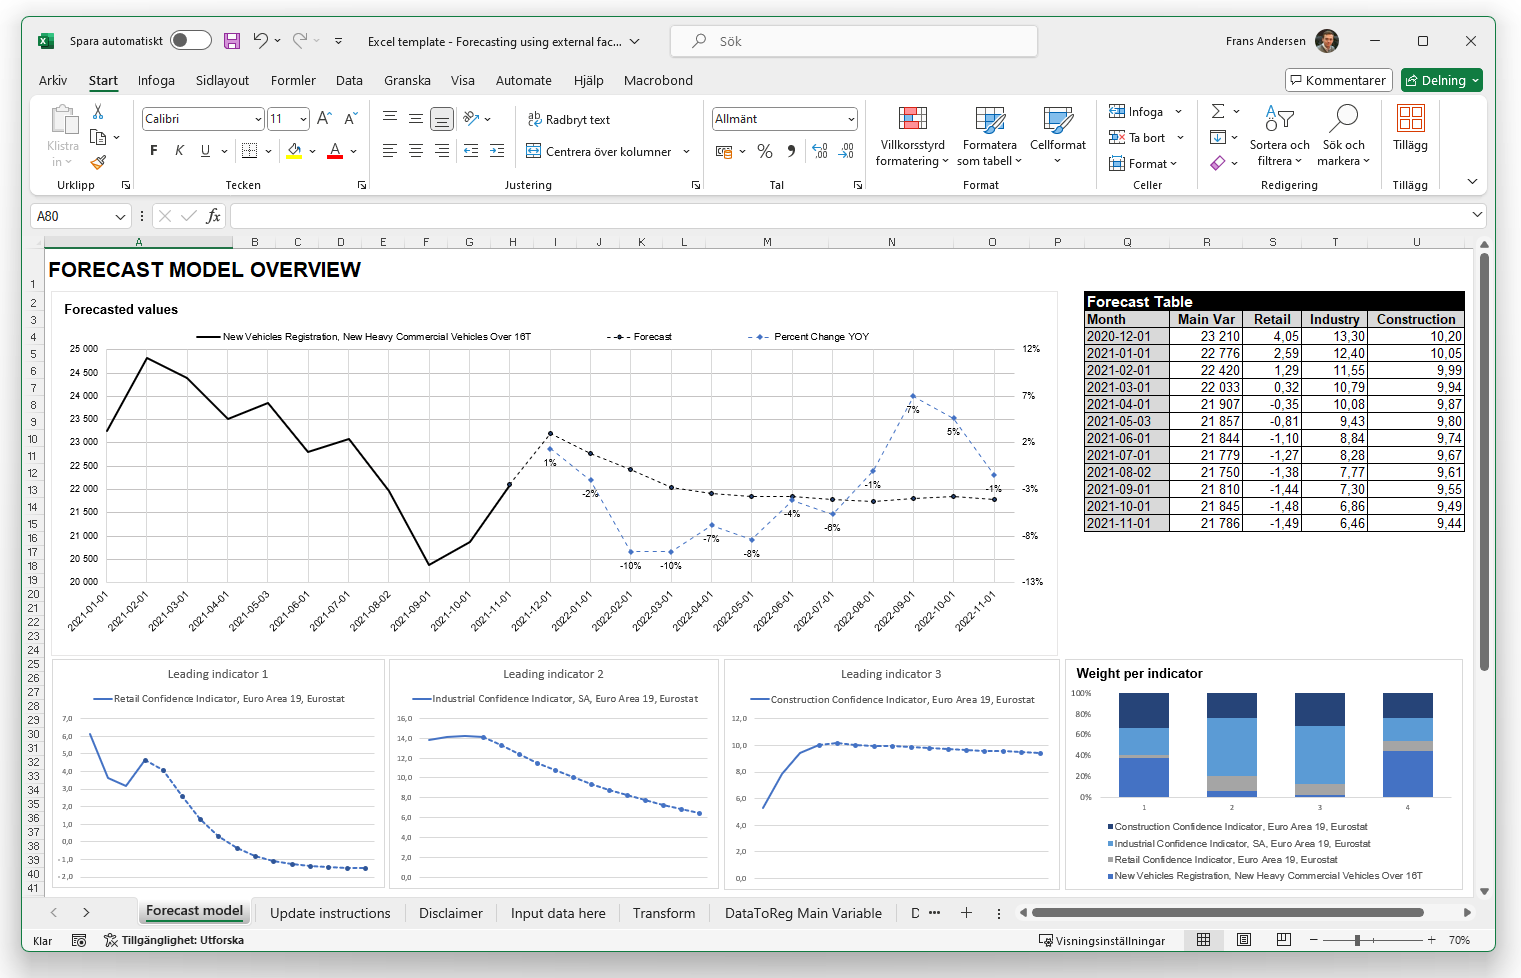
Most market forecasts start in Excel, and many stay there too long. A spreadsheet is the right tool for a first model. It becomes the wrong tool when the forecast has to cover many countries and segments, be updated every month and be defended in front of management.
Indicio replaces the spreadsheet with a forecast that updates itself: it finds the leading indicators behind your market, backtests more than 80 models and keeps the levels of the forecast consistent. This article describes when that move is worth making, and how teams make it.
Five signs the spreadsheet has reached its limit
- Updating takes days. GDP outlooks, interest rates and industry reports are gathered by hand and pasted in. Each new data release means doing it again.
- The method lives in one person’s head. The workbook has grown tab by tab. Nobody else can say why a coefficient is what it is, and there is little documentation.
- The levels do not add up. You forecast the total first, then countries, then segments. When you adjust one, another stops matching. Victor Van Cleemput at Toyota Material Handling described it this way: “It kind of had the feeling of a balloon: you fix one part and another problem pops up elsewhere.”
- Indicators are chosen by correlation. Two series that moved together in the past are not necessarily connected, and a correlation chart cannot tell you which indicator turns first. See why correlation is a weak way to select indicators.
- You cannot answer “how sure are you?” The spreadsheet gives one line. It has no backtest that shows how wrong the method has been before, and no range around the number.
What to keep from the Excel model
The spreadsheet holds real knowledge, and it should move with you:
- Your history. The cleaned series of market volumes, by country and segment, is the most valuable part.
- Your structure. How the market is split into regions, countries and segments reflects how the business is run.
- Your judgement about drivers. The indicators you believe in are good candidates to test. Some will hold up, some will not, and new ones will appear.
What to replace it with
A forecasting platform does the parts that a spreadsheet does badly:
- Data that updates itself. Indicators are refreshed when new figures are published, and the forecast is recalculated.
- Indicators selected by what they add to accuracy. Indicio searches more than 400 million external indicators and keeps the ones that lead your series. Read more in the guide to variable selection in forecasting.
- Many models, tested on your data. More than 80 models are backtested and the best are weighted into one forecast, with a range around it.
- Levels that stay consistent. The total, the countries and the segments are reconciled, so they add up without manual fixes.
- A reason behind every number. Each forecast shows which indicators moved it, so you can explain it to the people who decide.
How teams make the move
- Start with one series. Take the market total you know best and build the forecast on your own history.
- Backtest against the spreadsheet. Compare what each method would have forecast in past years with what actually happened.
- Run both in parallel for a while. Keep the Excel model until the new forecast has earned trust in a few planning rounds.
- Add countries and segments. Extend the hierarchy once the top level works.
It is a change in how the team works, not only a new tool. Steven Van Poecke at Toyota Material Handling put it like this: “We were used to using Excel, many tabs and sheets to make our correlations. Indicio is a different way of working.” Their implementation took about six months, alongside the team’s normal work. Read the Toyota Material Handling case.
If you are not ready to leave Excel
You can test the idea of leading indicators inside Excel first. Our free Excel forecast template lets you put up to three indicators next to your own series, tests them at different leads and produces a forecast. It shows what indicators can add, and where three indicators and one model stop being enough.
Frequently asked questions
Can Excel be used for market forecasting?
Yes, for a first model on one series with a few indicators. It becomes hard to maintain when the forecast covers many countries and segments, has to be updated every month and needs a documented method.
What is the main risk of an Excel-based forecast?
The method depends on the person who built it. Updates are manual, errors are hard to see, and the levels of the forecast drift apart when one of them is adjusted.
How long does it take to move from Excel to a forecasting platform?
A first forecast on your own data can be built and backtested in weeks. Moving a full hierarchy of countries and segments, and the team’s way of working, takes longer. Toyota Material Handling took about six months alongside its normal work.