

If aluminium is a large part of your costs, the price you put in next year’s budget matters more than most other assumptions. Many companies still use last year’s average, the current price or a figure from a bank report. A forecast built on leading indicators gives a better starting point, and a range to plan around.
Indicio builds that forecast automatically: it finds the indicators that lead the aluminium price, tests many models and combines the best into one forecast with a range. This article explains the method, so you can judge any aluminium forecast you are given.
Why aluminium prices are hard to forecast
Aluminium prices are driven by more than the metal’s own supply and demand. Broader market conditions, investor sentiment and macroeconomic trends all play a part, and energy is a large share of the cost of producing it. A method that only extends the price’s own history will miss the turns.
Step 1: Decide which price you are forecasting
Start from the price your contracts follow. For most buyers that is the London Metal Exchange (LME) cash price in US dollars per tonne, plus a regional premium and, for many, a currency effect. Forecast the benchmark first. Premiums and currency can be handled as separate series.
Step 2: Find the leading indicators
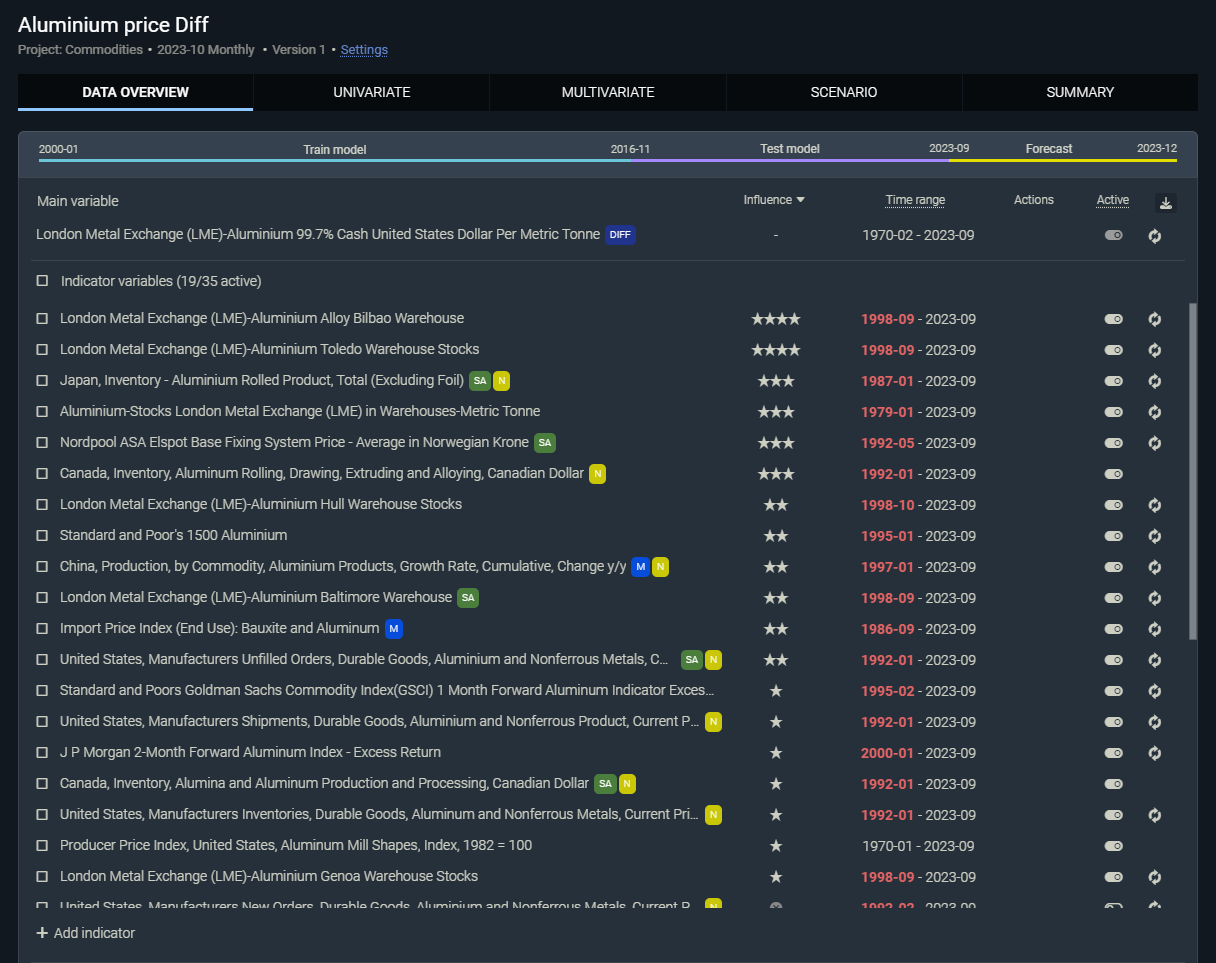
In Indicio’s aluminium forecast, three indicators rank highest:
- US new orders for aluminium and non-ferrous metals. Orders from manufacturers show demand before it reaches the metal market.
- China’s aluminium production. When output grows faster than demand, the surplus can push prices down.
- LME warehouse stocks. Stock levels show how much physical metal is available for delivery.
Electricity prices and the three-month forward price also appear in the ranking. The ranking changes over time, which is why the selection should be rerun as new data arrives, not fixed once.
Step 3: Test the indicators, do not just chart them
An indicator belongs in the model only if it improves the forecast on data the model has not seen. A chart where two lines move together is not a test. Read why correlation is a weak way to select indicators.
Step 4: Use several models and combine them
No single model is best in every market phase. In the aluminium price case, a library of multivariate models was ranked by forecast error, in and out of sample, and the best were combined into a weighted forecast. Each multivariate model forecasts its own indicators, so you do not have to supply forecasts of the indicators yourself.
Step 5: Budget on a range
A price forecast is a central estimate with a range around it. For a budget, that gives you three useful numbers: the central price, a high case and a low case. Purchasing and finance can then decide in advance what to do if the price moves towards either end, such as how much to hedge or which contracts to fix. See why a range is better than a single number.
Step 6: Test your assumptions with scenarios
Some risks are not in the history: a jump in energy prices, a change in trade rules or a production cut. With scenario analysis you set a path for one indicator, such as electricity prices, and see what it does to the aluminium price.
Step 7: Update every month
A budget is set once a year, and the price outlook changes every month. Rerun the forecast when new data is published and compare it with the budget price, so that a gap is seen early.
The same method for other metals
The steps are the same for steel and copper. The indicators differ: each metal has its own drivers, and they have to be found and tested for each one.
Frequently asked questions
What drives aluminium prices?
Demand from manufacturing and construction, production levels (China is the largest producer), stocks in exchange warehouses, energy costs and general market sentiment. Their relative importance changes over time.
Which leading indicators are used to forecast aluminium prices?
In Indicio’s aluminium forecast, the highest-ranked are US new orders for aluminium and non-ferrous metals, China’s aluminium production and LME warehouse stocks, followed by electricity prices and the forward price.
What aluminium price should I use in a budget?
Use the central forecast as the budget price, and plan for a high and a low case from the range around it. A single price with no range hides the risk the budget carries.