
New30 Oct 2026When the Forecast Becomes the Target: How to Keep Your Numbers Honest
Indicio

Home / Model library / Univariate, time series models

Model library · Univariate, time series models

Theta

The Theta model is a simple method for forecasting that involves fitting two theta-lines, forecasting the lines using simple exponential smoothing, and then combining the forecasts from the two lines to produce the final forecast.

The Theta model was developed in 2000 by Assimakopoulos & Nikolopoulos is a simple model which works by fitting two theta-lines, forecast both using exponential smoothing and combining the two forecasts to get the final result.

By modifying the local curvature of the time-series Yt​ based on a parameter Theta, θ a new series is created. These maintain the mean and the slope of the original data but not their curvatures. This is what is called a theta-line.

The theta-lines are calculated from the second difference of the time series
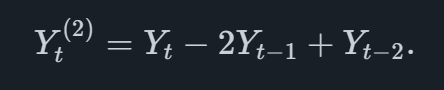
The theta-lines are then calculated as
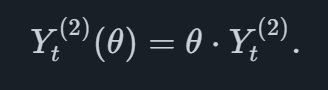
This has the effect of deflating the series towards a linear trend line, a value of θ=0θ=0 results in a straight line.

These two lines are then forecast using simple exponential smoothing and combined, producing a forecast

When it fits

  • Many series, little timeFast, robust and hard to break.
  • BenchmarkA strong yardstick in any backtest.

What to watch

  • No driversLike any univariate method, it cannot anticipate a turn that comes from the market.

Reference: Assimakopoulos, V. & Nikolopoulos, K. (2000). The theta model: a decomposition approach to forecasting. International Journal of Forecasting, 16(4), 521–530.

You don't have to pick the model

Indicio tests this model on your history next to 80+ others, at every horizon, and keeps the ones that forecast best. With leading indicators chosen for you from over 400 million series, and every number explained.

Book a demo