
New30 Oct 2026When the Forecast Becomes the Target: How to Keep Your Numbers Honest
Indicio

Home / Model library / Univariate, time series models

Model library · Univariate, time series models

TBATS

TBATS is a time series model that is useful for handling data with multiple seasonal patterns. TBATS is an acronym for key features of the model: T: Trigonometric seasonality B: Box-Cox transformation A: ARIMA errors T: Trend S: Seasonal components.

TBATS is a time series model that is useful for handling data with multiple seasonal patterns. TBATS is an acronym for key features of the model: T: Trigonometric seasonality B: Box-Cox transformation A: ARIMA errors T: Trend S: Seasonal components.

The first step towards fitting a TBATS model is to apply a Box-Cox transformation to the data. This is a flexible way to select and apply a power transformation to a series to obtain a shape which is easy to model. A parameter λλ between −5 and 5 is selected such that the transformation
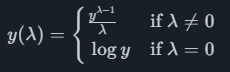
​will yield data that follows a normal distribution curve as closely as possible.

The model is then fitted using a combination of ARMA (see Advanced: ARIMA), exponential smoothing (see Advanced: ETS) and multiple seasonal patterns. Which of the components to include is selected based on Akaike's Information Criterion (AIC) which favors a simpler model over a more complicated while also prioritizing what fits the data best.

When it fits

  • Weekly and daily dataRetail, energy, call volumes and other series with several cycles.
  • Operational horizonsWhere the seasonal shape dominates.

What to watch

  • Slow on long seriesModel selection over many components takes time.
  • UnivariateNo leading indicators; pair it with a model that has them for longer horizons.

Reference: De Livera, A. M., Hyndman, R. J. & Snyder, R. D. (2011). Forecasting time series with complex seasonal patterns using exponential smoothing. Journal of the American Statistical Association, 106(496), 1513–1527.

You don't have to pick the model

Indicio tests this model on your history next to 80+ others, at every horizon, and keeps the ones that forecast best. With leading indicators chosen for you from over 400 million series, and every number explained.

Book a demo