We recently did a case study together with one of the major truck manufacturers on the number of registered commercial vehicles in Europe using the Indicio forecasting platform.
The analyses were done in monthly, quarterly and yearly view, with focus on the latter. The aim was to find driving market factors, policy and seasonality effects, but mainly to create an accurate forecast by applying both time series analysis and econometrics. The result was successful. The accuracy improvement was up to 60 % compared to commonly used models in BI-applications. This enables better capacity planning and production investment, leading to a substantial economic effect.
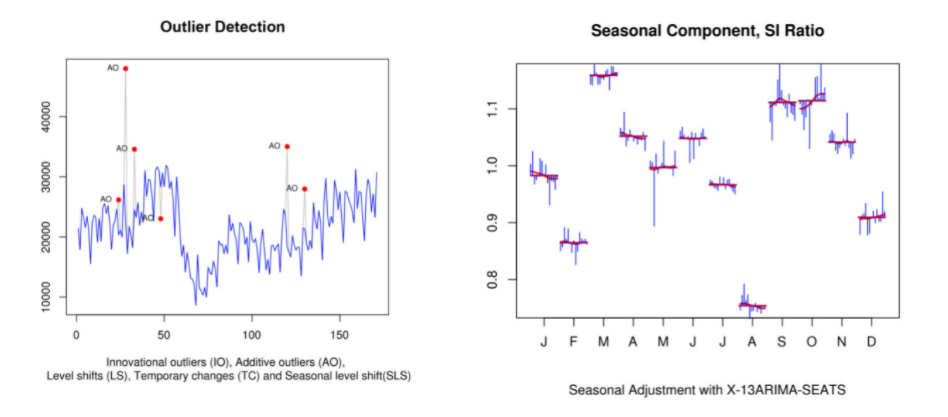
Our first find, that emission legislation has a large impact on registered CV’s, was expected, and seen when looking at the identified outliers in the monthly series. This means that the emission legislation can be modelled separately in a policy model. Secondly, a clear seasonal pattern was identified which strengthens the final model and adds to its explainability.
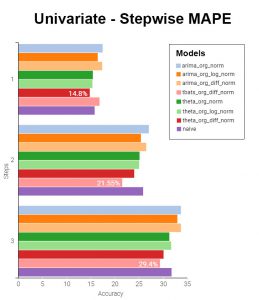
After the data had been pre-processed, Indicio applied simple univariate time-series models which were used for benchmarking towards the econometric models. This type of models are often seen in BI-applications and forecast reports from agencies such as Eurostat. Two common models are Exponential smoothening and ARIMA.
In this case, the forecasting error per year, illustrated in the plot below, showed that the best model on a 1 year horizon had an error of 14,8 %, on a 2 year horizon the error amounted to 21,55 % and on a 3 year horizon the error was 29,4 %.
Moving on to the second stage of the forecast process, we tried to beat this initial forecast by applying more advanced econometric forecast models.
The next step was to identify the leading indicators, as described in the blog post 3 ways to find the market dynamics. This has historically been done with correlation, Granger Causality or model fit. Indicio analyses the dynamics based upon each indicator’s effect on out-of-sample accuracy and ranks the indicators according to this.
The following indicators were tested:
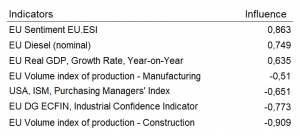
As seen above, the indicators that contributed to a more accurate forecast was the European economic sentiment indicator, the nominal European Diesel price and the year-on-year growth rate of European GDP. Other tested indicators could also carry some valuable information but in this case, they did not contribute to a higher accuracy. This could for example be due to other variables already containing the same information. These indicators were therefore excluded in the analysis. The final model had an out-of-sample, step ahead accuracy as described below:
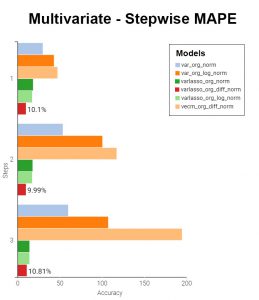
Compared to the best univariate model, the multivariate model achieved an accuracy improvement of 60 % on a 3 year horizon and 30 % on a 1 year horizon. This was due to the lagged relationship between the indicators and the forecasted variable. This type of model (vector auto regression) was first proposed by Chris Sims in the 1970s and later awarded the Nobel prize in 2011.