Have you ever wanted to lift the veil off your forecasting “black box” and be able to say with some level of certainty, “here we go, these are the market drivers that have a considerable impact on our numbers in the next quarter.”?
Now there’s a way.
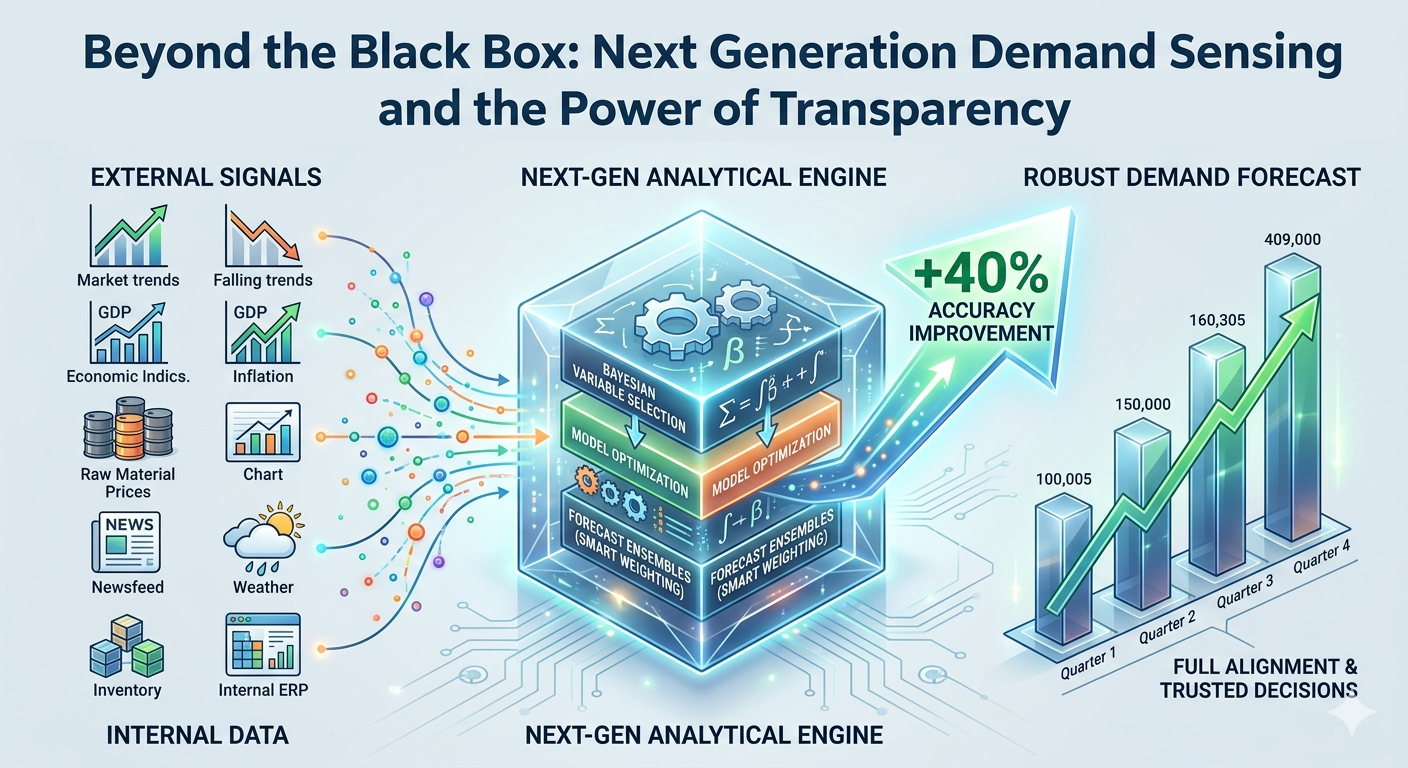
Cracking open the black box
Forecasting models, especially the complex ones, can often feel like a bit of a black box, no? Say, you’re interested in forecasting the demand for your various product lines. The model incorporates a wide array of features, including historical sales data, market trends, economic indicators, competitor pricing, seasonality, and promotional activities.
Although the models you have historically performed, it can be difficult for your teams to understand exactly what is driving demand or sales. Or both!
You’ll be able to translate complex model outputs into digestible insights, helping you communicate your findings in a way that makes sense to everyone, regardless of their technical know-how.
Drive data-driven decisions, fair and square
You want to be able to trust that the insights that you're drawing from your model are grounded in data-driven, unbiased insights. Using Shapley values, it ensures that every indicator gets the credit it deserves, based on its actual contribution to the prediction, at a given time horizon. By identifying which indicators have the most significant impact on demand predictions, it enables your team to focus their attention and resources on these key areas. See how it works in Indicio.
In this example where a company is forecasting retail sales; they begun by identifying and putting their leading indicators through the wringer, and getting a clear picture of the indicators that were relevant to their forecasted variable.

Following that, a forecast summary is generated, and by selecting any point in the forecast horizon, they had immediate insight into which indicators had a positive or negative impact on their forecast 3 months ahead.

The decrease they saw in the predicted number for December is slated to be attributed to the seasonally adjusted unemployment rate, as indicated by the negative SHAP value.

In other cases, if the models reveal that competitor pricing is a significant factor, there’s a potential signal to adjust your pricing strategies to become more competitive in key markets.
Speak the language of your stakeholders
When it’s time to present your forecasts to stakeholders, clarity is key.
When there is a lack of transparency, it can lead to hesitation in strategic decision-making, as stakeholders can't clearly see the 'why' behind the model's predictions.
In Indicio, having this view means you’ll be able to translate complex model outputs into digestible insights, helping you communicate your findings in a way that makes sense to everyone, regardless of their technical know-how.
Shapley values help lift the veil, providing a clear and detailed breakdown of how each indicator contributed to a specific prediction. It's like having a backstage pass to your models’ inner workings! But also providing you with actionable insights.