
“Sales next quarter: 10,000 units.”
It looks clear, precise and confident. It fits nicely in a cell, on a slide and in a budget. And it is almost certainly wrong.
Not because the forecaster did a bad job, but because no one can predict the exact future. The real question is not whether the forecast will miss, but by how much. A single number cannot answer that. A prediction interval can.
What a point forecast really is
Every data series is made of structure and noise. The structure is the pattern we can model: trend, seasonality and the effect of leading indicators. The noise is the random part that no model can predict.
So a point forecast is not “what will happen”. It is the middle of a range of possible outcomes, usually the average. The rest of that range is still there, even if we do not show it.
A simple example: selling ice cream
Imagine an ice cream stand with five regular customers. Each customer buys between 0 and 4 ice creams a day, and every amount is equally likely. On average, each one buys 2. So the forecast for a day is 5 × 2 = 10 ice creams.
Now look at what actually happens over many days:
- Sales are exactly 10 on only about one day in eight.
- On more than 8 days out of 10, sales land somewhere between 6 and 14.
- About once a month, sales drop to 3 or below, or jump to 17 or more, just by chance.
The forecast of 10 is the best single number we can give. But if you plan your stock, staff and cash around exactly 10, you will be wrong almost every day. The range from 6 to 14 is what actually helps you plan.
A point forecast tells you the middle. A prediction interval tells you what you are planning for.
Why a single number is dangerous
- It looks more certain than it is. “10,000 units” sounds like a fact. As it travels through the organization, any doubt the analyst had is lost. Soon someone treats it as a sure thing.
- It hides the risk. Two forecasts can both say 10,000. One means “between 9,500 and 10,500”. The other means “between 6,000 and 14,000”. Those call for very different decisions, but the single number looks exactly the same.
- Plans built on the middle often fail. If you stock exactly the forecast, you will run out roughly half the time. And when running out costs more than having too much (or the other way around), the middle is rarely the right number to plan for.
- You cannot tell a bad forecast from bad luck. Sales came in at 9,200. Was the forecast poor, or was that normal noise? Without a range, there is no way to know, and people often blame the wrong thing.
- It easily turns into a target. A single number is the easiest thing to put in a budget. Once it is there, it stops being a forecast at all.
What a prediction interval tells you
A prediction interval is a range where the future value is expected to fall, with a stated probability. For example: “Sales will most likely be 10,000 units, and there is an 80% chance they will be between 8,500 and 11,500.”
A few things are worth knowing:
- Misses are part of the deal. An 80% interval means that about 1 time in 5, the actual result will fall outside. That is not a failure. It is exactly what 80% means.
- The width is information. A narrow interval means the future is fairly predictable. A wide one is a warning that you should prepare for more than one outcome.
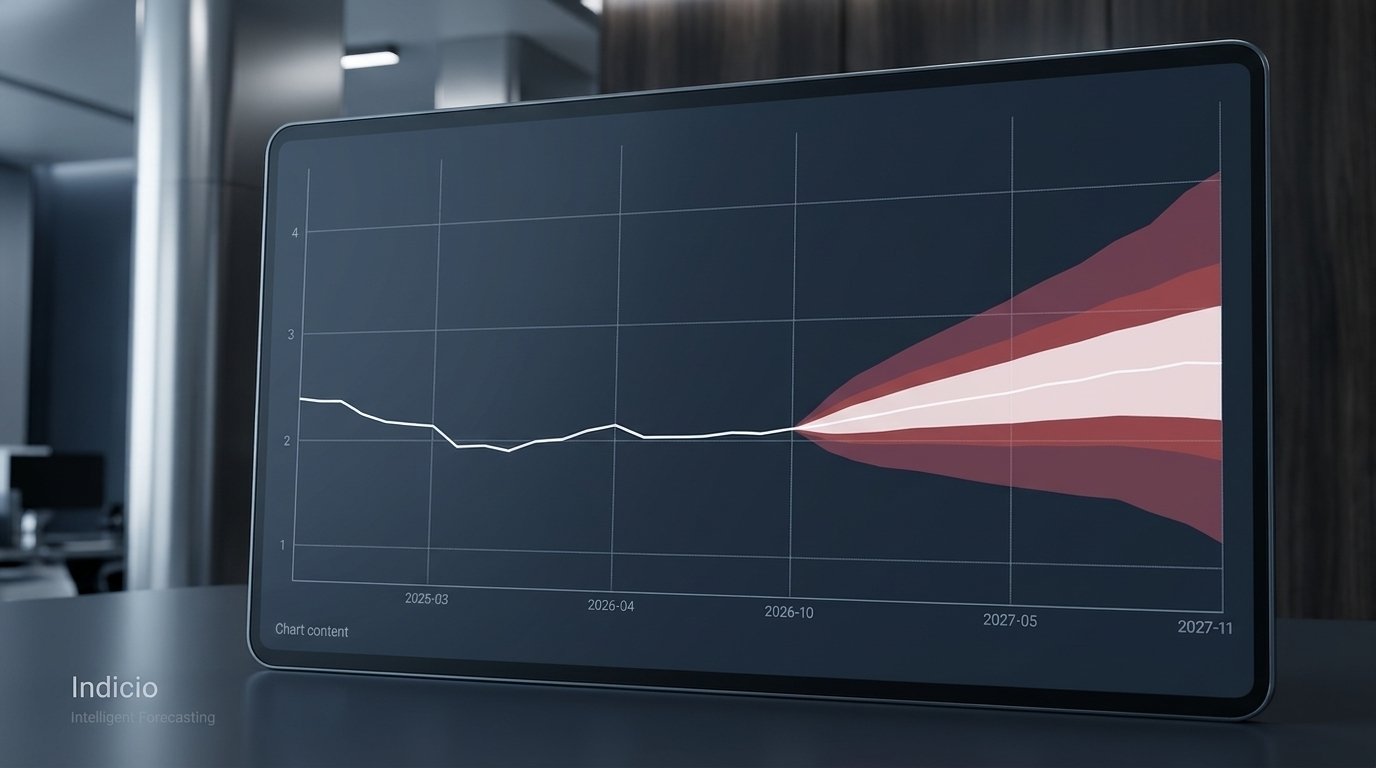
- Intervals grow with the horizon. Next month is easier to forecast than next year. Errors build up as you look further ahead, so the range gets wider. This is why central banks such as the Bank of England have long used “fan charts”, where the band of possible outcomes spreads out over time.
- It is not a confidence interval. The two are often mixed up. A confidence interval describes the uncertainty around an average. A prediction interval describes where a single future value may land, so it is much wider. Using one in place of the other makes a forecast look far more certain than it is.
Putting intervals to work
Prediction intervals are not just a nicer chart. They change the decisions you can make:
- Inventory and capacity. Choose how much risk you accept. If you want enough stock 95% of the time, plan for the level that demand is expected to stay below 95% of the time. That is near the top of the range, not the middle.
- Budgeting. Build a plan for the likely case, and know in advance what you will do in the low and high cases. No one is surprised when results land inside the range.
- Targets. Compare your target with the range. Is the target near the middle, at the edge or outside it completely? Now you can talk about how likely you are to hit it.
- Risk. Look at the downside. How bad could the low end be, and can the business handle it?
- Evaluation. Judge forecasts fairly. A result inside the interval is normal noise. Results that keep landing outside are a sign that the model needs attention.
Getting the interval right
An interval is only useful if it is honest. The most common problem is intervals that are too narrow. Most statistical models build their intervals only from the random noise they have seen in the past. They leave out other sources of uncertainty: whether the model’s settings are right, whether it is the right model at all, and whether the future will behave like the past. One study of a common family of forecasting models found that intervals labeled 95% contained the actual result only 71% to 87% of the time.
Some simple checks help:
- Count your hits. Over time, about 80% of actual results should fall inside your 80% intervals. If it is far fewer, your forecasts are overconfident. If it is nearly all of them, your ranges may be too wide to be useful.
- Narrow the range the right way. A better model, with the right leading indicators, can give a tighter range because it explains more of the real structure. Shrinking the range just to look more confident does the opposite.
- Add what the model cannot see. Some uncertainty comes from things that are not in the data yet: a new competitor, a policy change, a supply shock. Expert knowledge and scenarios help capture that.
How Indicio helps
Every forecast in Indicio comes with prediction intervals, so you always see the range and not just a single number.
Indicio also gives you a stronger starting point for making those ranges honest. It tests many econometric, statistical and machine-learning models on your data and leading indicators, and combines the best ones, so you are not relying on a single model’s view of the future.
Every model is backtested, so you can see how large the errors have really been in the past, not just how well a model fits the data. And with scenario analysis, you can see how the forecast moves when a key driver changes, which is a practical way to explore realistic outcomes that history alone does not cover.
Indicio’s scenario analysis is built on Bayesian conditional forecasting, which takes uncertainty in the model’s parameters into account and gives you a range of outcomes for each scenario, not just a single line.
Takeaway
A single number is easy to share, but it hides the most important part of a forecast: how uncertain it is. Prediction intervals bring that uncertainty into the open, so people can plan for the range, manage the risk and judge forecasts fairly.
Next time someone asks “what is the number?”, give them the number and the range.
It is better to be roughly right than precisely wrong.